ALTERATIONS IN EEG ACTIVITY DURING AN N-BACK TASK IN SCHIZOPHRENIA (DR. ANTONIO ARJONA)
In the last two decades there has been a significant increase in the number of publications that highlight deficits in working memory as a central factor within the cognitive symptomatology associated with schizophrenia (Sz). However, there is still a wide lack of knowledge about the neuropsychological substrates associated with such deficits. In this sense, the study of the brain’s oscillatory activity using electroencephalography (EEG) is one of the methods that tries to shed light on the functioning of the different cognitive functions, including working memory.
In repeated publications, the cognitive deficits of the Sz have been associated with alterations in the different brain rhythms, although up to now the results obtained have not been 100% consistent. The research carried out in our group is aimed at providing some information in this field.
The study presented has the EEG data of 35 healthy controls and 50 patients with Sz. The main objective has been to analyze the brain rhythms while they both showed to be performing an n-back auditory task in two modalities: 0-back and 1-back. The 0-back mode would be equivalent to the oddball type tasks where the subject presses a button when he or she hears an infrequent sound, while the 1-back mode would include the addition that the infrequent sound must be preceded by another infrequent sound in order for the button to be pressed. This combination of 2 samples and two tasks allowed us to analyze the differences between groups, between tasks, as well as the possible lack of similarity in the differences between tasks in both groups.
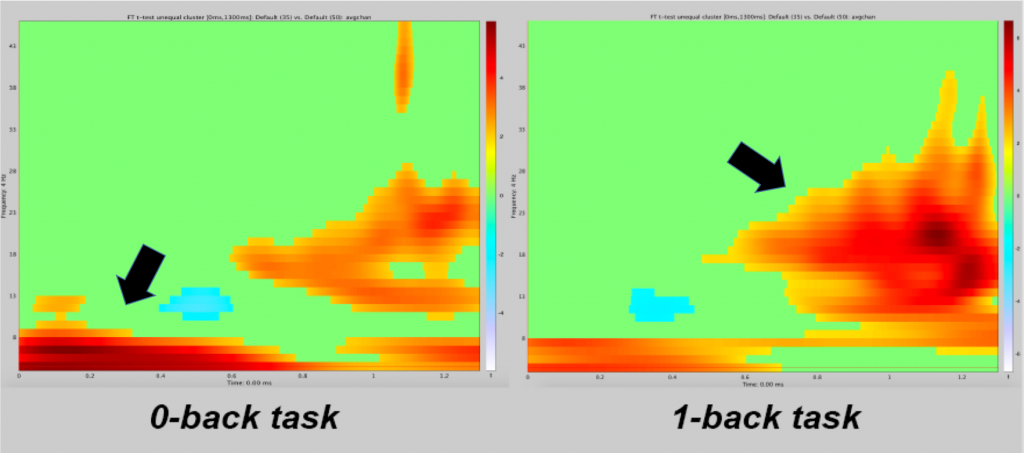
In the preliminary results of the study, it is highlighted that patients with Sz show a lower absolute power both in the theta rhythm during the 600 milliseconds after the arrival of the infrequent sound and in the beta rhythm around 1 second after the arrival of the infrequent sound. These differences are observed in both modes, although they are more accentuated in the theta rhythm during 0-back and in the beta rhythm during 1-back. The Figure below shows the statistically significant differences between the two samples. It can be seen that these differences are more accentuated in the theta band with 0-back (left graph) and in the beta band with 1-back (right graph).


